Volatility Drag
Simply put volatility will lower your returns in the long run.
This chart demonstrates the impact of volatility.
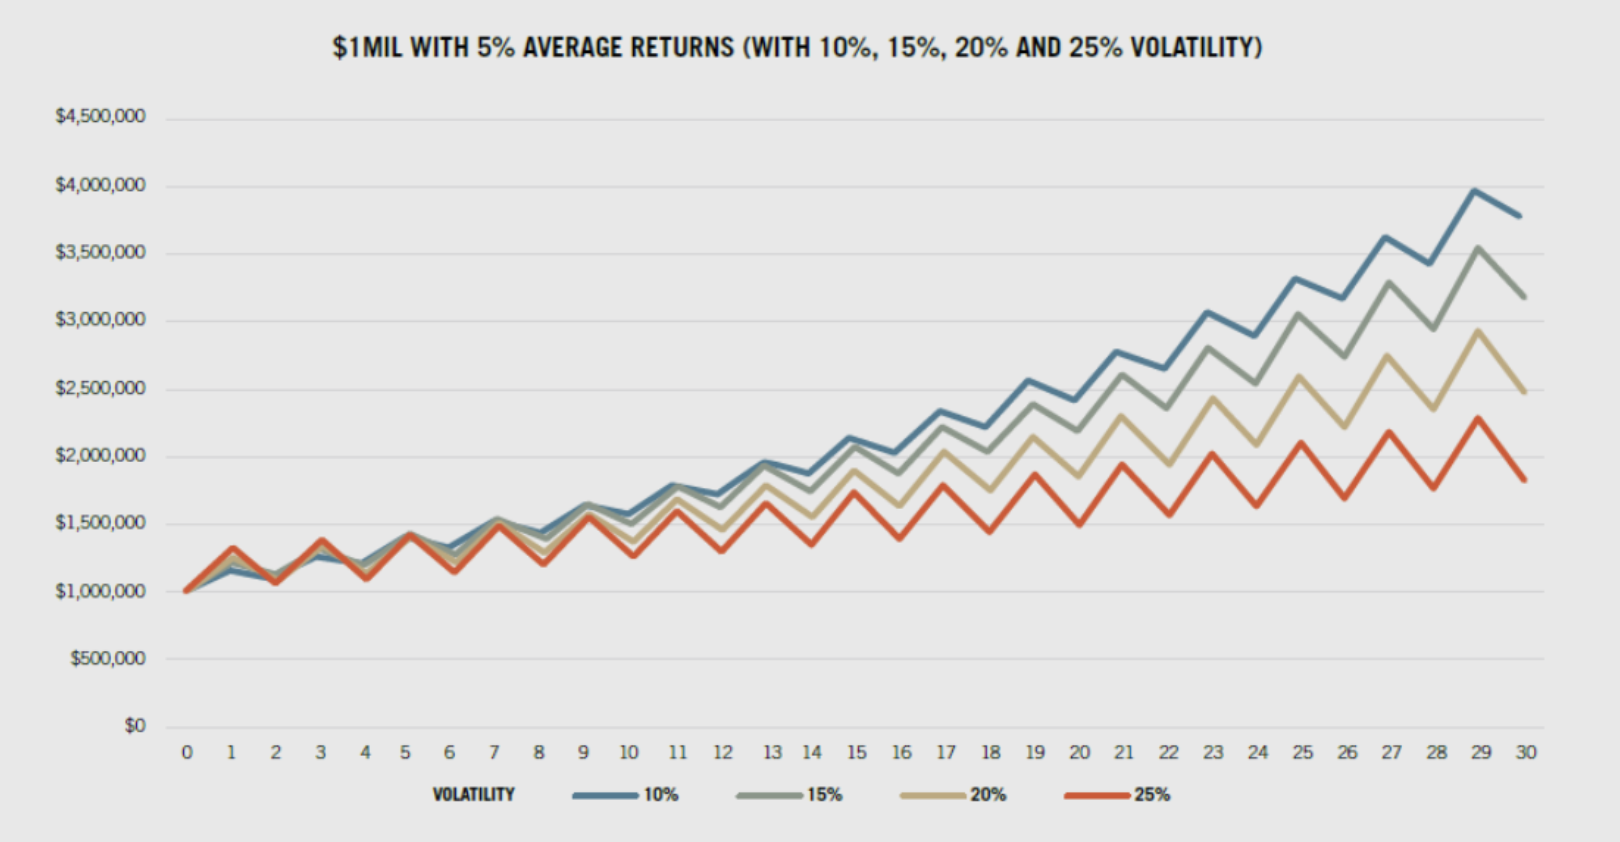
All four of these lines represent an average 5% return. The only difference between them is how much the returns fluctuate from year to year. In the case of the 10% volatility example, with 5% as the average return, you oscillate between a +15% one year and -5% the next.
Specifically, each line is represented as follows:
| Volatility | Starting Value | Terminal Value (30 Years) |
|---|---|---|
| 10% | $1,000,000 | $3,769,829 |
| 15% | $1,000,000 | $3,172,169 |
| 20% | $1,000,000 | $2,482,756 |
| 25% | $1,000,000 | $1,800,944 |
In the short run, there’s not a wide difference in outcomes; notice how after year three or so the portfolios are tracking fairly closely. But after about the tenth year, they begin to diverge quite a bit. And after 30 years, the differences are dramatic. The 10% volatility portfolio has more than $3.7 million, but the 25% volatility portfolio has only $1.8 million.
Deta puts volatility front and center for you to make your investment decisions. Create your portfolio in Deta and see how volatility is affecting your returns and learn how to reduce volatility.
Register